


Retire While You Work® Podcast
Join us as we discuss various topics to help you find the path to viewing money as a means to the true currency, TIME, and learn how to build more memories and experiences.
View All Episodes


Join us as we discuss various topics to help you find the path to viewing money as a means to the true currency, TIME, and learn how to build more memories and experiences.
View All Episodes


On Monday, the Treasury Department is expected to report a March budget deficit of about $658 billion, bringing the 12-month total to nearly $4.1 trillion, about 19% of GDP. Proponents argue that the added spending, with more to come, will help to ensure the recovery. Critics charge that it’s overkill, likely to push aggregate demand ahead of supply. The debate over infrastructure spending will amplify these divisions.
The increase in spending reflects last year’s $2.2 trillion Coronavirus Aid, Relief, and Economic Security Act (CARES Act), the $900 billion Health and Economic Recovery Omnibus Emergency Solutions Act (Heroes Act), and the $1.9 trillion American Rescue Plan Act of 2021. While the three bills total $4.0 trillion, not all of that has been spent. Remember, the annual deficit was on track to exceed $1 trillion before the pandemic. Unlike the Tax Cut and Jobs Act of 2017 (TCJA), which focused relief at the upper end of the income scale, the American Rescue Plan provides larger tax cuts (percentage-wise) to lower income households. The Tax Policy Center estimates that households making under $25,000, would see an after- tax income gain of 20%, and about 35% if they have children. A middle-income household would see a gain of 5.5%.
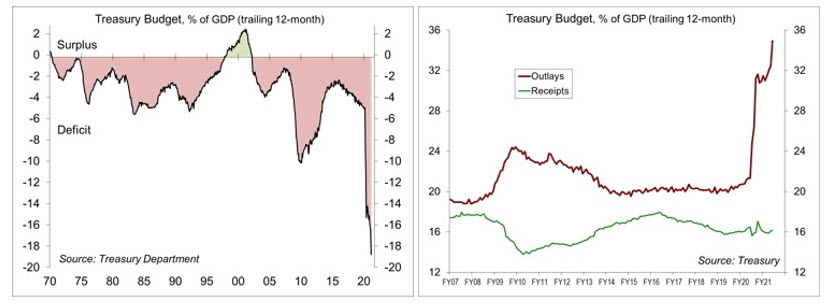
Government spending fell after the fiscal response to the financial crisis and we can expect it to fall again in this recovery. However, support following the financial crisis, while helping to limit the damage, was not enough to propel the recovery forward. This time, spending will continue into 2022.
Some of the spending will be hard to get rid of. For example, if childhood poverty is cut in half, as many expect, why would you want to do that for just one year? Much of the added spending, including child tax credits, is popular.
The Biden administration has now proposed a $2 trillion infrastructure plan, which broadens the definition of “infrastructure” well beyond roads and bridges, and in its FY22 budget proposal, has asked Congress for a 16% increase in federal spending on domestic priorities, including education, fighting climate change, and reducing poverty.
So how will we pay for all of this? Partly through an increase in corporate taxes, increased enforcement (going after tax cheaters), and reducing “tax expenditures” (tax breaks embedded in the tax code). All of that could be done through tax reform, but that’s viewed as politically unfeasible.
Of course, not all of the added spending has to be paid for. The government is nothing like a household or business. It doesn’t have to balance its budget or pay down its debt. It just has to meet interest payments and roll over maturing debt – there is no problem in doing so now. Investment in infrastructure, education, childcare, and research and development should pay off over the long run, leading to a more productive, efficient, and larger economy, but we won’t know for sure until it happens.
Recent Economic Data
The minutes of the March 16-17 Federal Open Market Committee showed that most Fed officials expected a transitory increase in inflation. Inflation risks were seen as balanced. Several officials feared that supply disruptions and strong demand would push inflation higher than expected, while several others felt that the factors that had kept inflation down could exert more downward pressure on inflation.
The ISM Services Index rose to 63.7 in March, from 55.3 in February, partly reflecting a rebound from bad weather. The report showed business activity, new orders, and employment rising at a faster pace, while supplier delivery times lengthened further and input price pressures continued to rise.
In its revised World Economic Outlook, the IMF raised expectations for global growth (+6.0% y/y), led by stronger expectations for the U.S. (fueled by the faster arrival of vaccines and further fiscal stimulus).
The Producer Price Index rose 1.0% in March (+4.2% y/y), reflecting an 8.8% increase in gasoline (+52.5% y/y). Ex-food, energy, and trade services, the PPI rose 0.6% (+3.1% y/y).
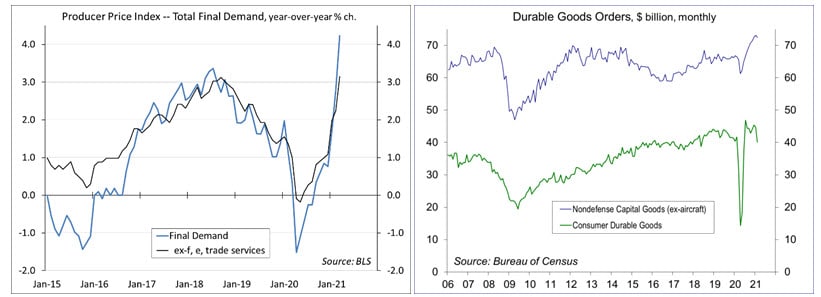
Factory Orders fell 0.8% in February, reflecting bad weather.
The trade deficit widened to $71.1 billion in February, vs. $67.8 billion in January and $38.0 billion a year earlier. Merchandise exports fell 3.5% (-5.1% y/y), reflecting bad weather. Merchandise imports fell 0.9% (+10.3% y/y).
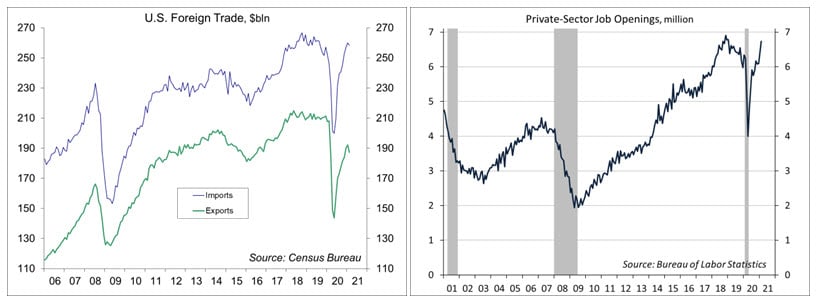
JOLTS data for February showed that job openings rose to 7.37 million in February (6.73 million private sector).
Gauging the Recovery
The New York Fed’s Weekly Economic Index rose to +9.52% for the week ending April 3, up from +8.13% a week earlier (revised from +7.25%), signifying strength relative to the weak data of a year ago. The WEI is scaled to year-over-year GDP growth.
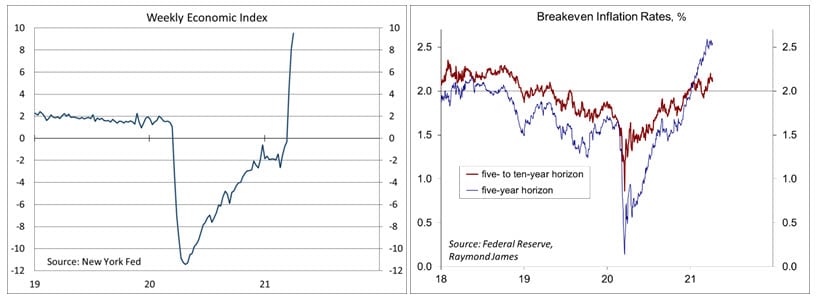
Breakeven inflation rates (the difference between inflation-adjusted and fixed-rate Treasuries) continue to suggest a moderately higher inflation outlook for the next five years, but the outlook five to ten years out remains close to the Fed’s long-term goal of 2% (consistent with the Fed’s revised monetary policy framework).
The trend in COVID-19 cases appears to be stabilizing, down sharply from the start of the year, but still relatively high (about the peak of the second wave). More than 540,000 have died from COVID-19 in the U.S.
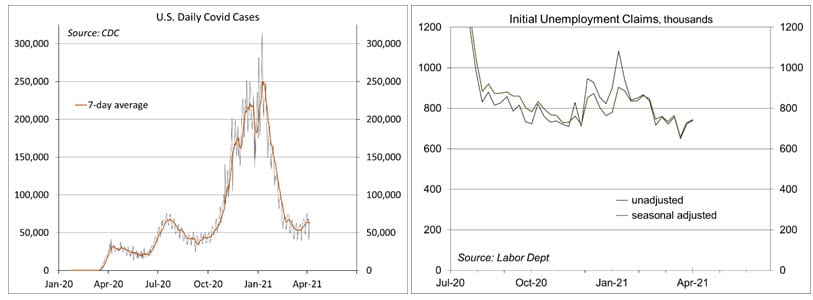
Jobless claims rose by 16,000, to 744,000, in the week ending April 3. The overall trend is gradually lower, but the level remains quite high by pre-pandemic standards. The continued elevated level of claims appears to partly reflect people repeatedly getting short-term work.
The University of Michigan’s Consumer Sentiment Index rose to 84.9 (a 12-month high) in the full-month assessment for March (the survey covered February 24 to March 22), vs. 83.0 at mid-month and 76.8 in February. The report noted gains from disbursement of relief checks and better than anticipated vaccination progress. The data point toward “robust increases in consumer spending.”
The opinions offered by Dr. Brown should be considered a part of your overall decision-making process. For more information about this report – to discuss how this outlook may affect your personal situation and/or to learn how this insight may be incorporated into your investment strategy – please contact your financial advisor or use the convenient Office Locator to find our office(s) nearest you today.
All expressions of opinion reflect the judgment of the Research Department of Raymond James & Associates (RJA) at this date and are subject to change. Information has been obtained from sources considered reliable, but we do not guarantee that the foregoing report is accurate or complete. Other departments of RJA may have information which is not available to the Research Department about companies mentioned in this report. RJA or its affiliates may execute transactions in the securities mentioned in this report which may not be consistent with the report’s conclusions. RJA may perform investment banking or other services for, or solicit investment banking business from, any company mentioned in this report. For institutional clients of the European Economic Area (EEA): This document (and any attachments or exhibits hereto) is intended only for EEA Institutional Clients or others to whom it may lawfully be submitted. There is no assurance that any of the trends mentioned will continue in the future. Past performance is not indicative of future results.

Adams Wealth Partners, LLC is not a registered broker/dealer and is independent of Raymond James Financial Services. Investment advisory services offered through Raymond James Financial Services Advisors, Inc. Securities offered through Raymond James Financial Services, Inc., member FINRA/SIPC
Neither Raymond James Financial Services nor any Raymond James Financial Advisor renders advice on tax issues, these matters should be discussed with the appropriate professional.
Links are being provided for information purposes only. Raymond James is not affiliated with and does not endorse, authorize, or sponsor any of the listed websites or their respective sponsors. Raymond James is not responsible for the content of any website or the collection or use of information regarding any website's users and/or members.
The running stock ticker is not a recommendation to buy or sell stocks of the companies pictured.
Securities offered through Raymond James Financial Services, Inc., member FINRA/SIPC, marketed as Adams Wealth Partners. Investment advisory services offered through Raymond James Financial Services Advisors, Inc.Adams Wealth Partners is separately owned and operated and not independently registered as a broker-dealer or investment adviser.
Certified Financial Planner Board of Standards Inc. owns the certification marks CFP®, CERTIFIED FINANCIAL PLANNER™, CFP® (with plaque design) and CFP® (with flame design) in the U.S., which it awards to individuals who successfully complete CFP Board's initial and ongoing certification requirements. CFP® holders at Adams Wealth Partners, LLC are: David Adams, Myles Zueger, Carson Odom, Spencer Provow, and Nick Wolf.
CPA holders at Adams Wealth Partners, LLC are: David Adams, Carson Odom, and Christine Kinsley
CFA holders at Adams Wealth Partners, LLC are: Anthony Breen.
Please note that all archived content is for informational purposes only. Investment decisions should not be based on the content provided herein. For the most up-to- date statistical information and analysis, please contact your financial professional.
Raymond James financial advisors may only conduct business with residents of the states and/or jurisdictions for which they are properly registered. Therefore, a response to a request for information may be delayed. Please note that not all of the investments and services mentioned are available in every state. Investors outside of the United States are subject to securities and tax regulations within their applicable jurisdictions that are not addressed on this site. Contact your local Raymond James office for information and availability.
2026 Forbes America's Best-In-State Wealth Management Teams, developed by Shook Research, is based on the period from 3/31/2024 to 3/31/2025 and was released on 1/7/2026. Approximately 12,787 team nominations were received and 6,149 advisor teams won. Neither Raymond James nor any of its advisors pay a fee in exchange for this award. More: https://bit.ly/4rXUfUA. Please see https://bit.ly/40mwRVe for more info.
Barron’s Top 1,500 Financial Advisors 2026, is based on the period from 09/30/2024 – 09/30/2025 and was released on 03/20/2026. 7,855 nominations were received and 1,500 won. Neither Raymond James nor any of its advisors pay a fee in exchange for this award. More: https://bit.ly/4smNviU.
Please note that all archived content is for informational purposes only. Investment decisions should not be based on the content provided herein. For the most up-to- date statistical information and analysis, please contact your financial professional.
Raymond James is not affiliated and does not endorse the above-mentioned organizations.
Nashville Wealth Management & Financial Advisors | David Adams CPA, CFP® | Copyright © 2026 | Privacy Notice | Legal Disclosure